- Investment
- Explore
-
Tools

SIP Calculator Calculate Future value of SIP Investment

Lumpsum Calculator Calculate Future Value , Period , Returns of Lumpsum investments

Step-Up SIP Calculator Step Up Your SIP Strategy with Our Calculator

Tax Calculator Calculate Amount of Tax Saving & Investment Amount

Retirement Calculator Retirement Corpus & Investment Amount

Compare Funds Comparison of fund details

All Calculator All Financial Calculators at your Fingertips
- Blogs
-
Pro Services


Mutual Funds
Invest your money in mutual funds online. Explore the best mutual funds in India that generate higher returns than inflation and safely achieve your financial goals.

 1 Lac Users Downloaded this Report
Discover the Best Funds for ₹500 SIP in 2025
Exclusive Report by Team of MF Experts
See Funds NowWhat are Mutual Funds?
A mutual fund is an investment option created by AMCs (asset management companies) that appoints a fund manager to pool money and invest across various asset classes such as equity, debt, gold and other securities to generate good returns with secured risk from the different types of financial resources.

Ways to Invest In Mutual Funds
SIP
SIP stands for a systematic investment plan, a disciplined way to invest a fixed amount regularly, monthly, quarterly or yearly to build long term wealth.

Lumpsum
A lump sum investment is investing a large sum of money as a one-time investment on a particular mutual fund scheme instead of paying in instalments.
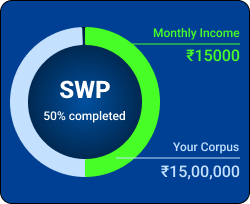
SWP
SWP or a systematic withdrawal plan, a tool that helps you withdraw a fixed amount from your mutual funds regularly for a steady source of income.
STP
The full form of STP is a systematic transfer plan, an investment strategy that allows you to transfer money from one mutual fund scheme to another.
Types of Mutual Funds
Equity Funds
Equity Funds are specific funds that invest 60% or more in the stock market (equity stocks) for long-term returns.
Types of Equity Funds
Invests at least 80% of money in top 100 companies.
Invests up to 65% of money in mid-sized growing companies.
Invests 65% of money in 251st-ranked companies.
Invest 25% of the money equally in large, mid and small cap stocks.
Best Equity Fund By Our Expert
 High Growth Fund

17.99% p.a.

Best Debt Fund By Our Expert
Best for Passive Investing
7.5% p.a.
DEBT FUNDS
Debt Funds invest in fixed-income securities to give steady income like corporate bonds & government securities.
Types of Debt Funds
Invests 100% in money market instruments with up to 91-day maturities.
Invests at least 80% of money in short-term debt instruments for 1-3 years.
Invests up to 80% of money in high-rated corporate debt securities.
Invests 100% of money in bonds issued by the government, eg, treasury bonds.
HYBRID FUNDS
Hybrid Funds invest in mixed asset classes like equity, debt, and gold, giving the benefits of a multi-cap strategy via single scheme.
Types of Hybrid Funds
Invests 60-80% of money in equity & 20-35% in debt securities.
Invests 65% in equity derivatives, rest in stocks & bonds.
Invests 10% of assets amongst equity, debt and gold.
Shifts allocation in equity and debt based on market conditions.
Best Hybrid Fund By Our Expert
Best for Balanced Growth

18.41% p.a.
Best Other Fund By Our Expert
See All Other Funds
OTHER FUNDS
Other Funds include investment options that don’t fit into traditional equity or debt categories, offering unique ways to diversify your portfolio.
Types of Other Funds
Invest in gold securities & mining stocks for gold price appreciation.
Invest in foreign stocks or bonds for global diversification.
Tracks Nifty 50 & S&P 500 for low-cost broad market exposure.
Invest in silver ETFs or mining companies for price growth.
Benefits of Investing in Mutual Funds

Diversification
A single fund gives benefits by investing in a variety of stocks and bonds, minimizing overall risk.

Flexibility
You can choose to invest in varied asset types and adjust invested amount to align with your goals.

Professional Management
The funds are managed by experienced analysts who strategically invest money to maximize returns.

Transparency
Full disclosure of your investments helps you make informed adjustments to your portfolio.

Liquidity
Freedom to buy and sell your mutual funds anytime without having its price affected.

Systematic Investment
You can build strong long-term wealth by making small regular payments via SIPs.
Top Performing Mutual Funds in India for High Returns
Returns
SIP Returns
Risk
Information
NAV Details
Data in this table : Get historical returns. If 1Y column is 10% that means, fund has given 10% returns in last 1 year.
Select date points :
Submit| Fund Name | AUM (Cr.) | Fund Age | 1W | 1M | 3M | 6M | YTD | 1Y | 2Y | 3Y | 5Y | 10Y | |
|---|---|---|---|---|---|---|---|---|---|---|---|---|---|
| 86.32 | 3 years | 6.46% | -15.93% | 16.28% | 11.52% | 15.09% | 67.45% | 19.44% | 14.67% | - | - | Invest | |
| 1089.01 | 17 years | 16.62% | 14.86% | 35.11% | 27.57% | 45.66% | 56.09% | 21.64% | 13.61% | 12.32% | 11.38% | Invest | |
| 346.48 | 7 years | 3.64% | 10.2% | 2.51% | -1.99% | -2.5% | 31.86% | 29.87% | 18.65% | 26.8% | - | Invest | |
| 1022.83 | 13 years | 3.42% | 7.2% | 5.63% | 17.44% | 8.84% | 29.97% | 18.42% | 18.73% | 14.52% | - | Invest | |
| 79.59 | 1 years | 3.4% | 7.16% | 5.64% | 17.31% | 8.78% | 29.67% | - | - | - | - | Invest | |
| 164.28 | 2 years | 4.25% | 6.41% | -1.01% | 11.8% | 8.82% | 28.47% | 14.89% | - | - | - | Invest | |
| 1575.68 | 13 years | 3.87% | 7.97% | 18.05% | 22.13% | 20.68% | 28.06% | 22.63% | 19.54% | 13.25% | 11.89% | Invest | |
| 1568.02 | 1 years | 2.97% | 3.68% | -2.41% | -4.99% | -8.16% | 27.14% | - | - | - | - | Invest | |
| 471.82 | 13 years | 5.99% | 7.11% | 17.15% | 21.91% | 21.5% | 26.84% | 21.91% | 18.75% | 9.86% | 11.69% | Invest | |
| 80.36 | 12 years | 5.65% | 6.35% | 22.96% | 21.67% | 22.96% | 26.76% | 21.54% | 19.21% | 13.29% | 11.37% | Invest | |
| 113.72 | 13 years | 5.73% | 6.78% | 17.64% | 21.49% | 20.99% | 26.64% | 21.84% | 18.99% | 13.08% | 11.83% | Invest | |
| 3059.77 | 13 years | 5.78% | 7.13% | 17.48% | 21.62% | 20.75% | 26.55% | 21.93% | 18.97% | 11.45% | 11.94% | Invest | |
| 699.09 | 13 years | 5.5% | 6.82% | 17.21% | 21.45% | 20.03% | 26.44% | 21.82% | 19.05% | 11.05% | 11.5% | Invest | |
| 2439.26 | 14 years | 5.4% | 6.61% | 17.1% | 21.39% | 20.56% | 26.37% | 21.76% | 18.83% | 12.31% | 11.75% | Invest | |
| 57.09 | 1 years | 5.32% | 6.53% | 17.16% | 21.35% | 20.38% | 26.17% | - | - | - | - | Invest | |
| 2520.47 | 14 years | 5.48% | 6.49% | 16.86% | 21.22% | 20.04% | 26.15% | 21.63% | 18.42% | 11.74% | 11.56% | Invest | |
| 160.63 | 1 years | 6.24% | 7.31% | 17.77% | 21.61% | 20.84% | 26% | - | - | - | - | Invest | |
| 2522 | 13 years | 5.44% | 6.64% | 17.01% | 21.45% | 20.47% | 25.8% | 22.11% | 19.15% | 10.9% | 11.98% | Invest | |
| 189.7 | 21 years | 0.24% | 1.35% | 15.59% | 17.35% | 15.76% | 22.2% | 18.58% | 13.86% | 10.77% | 8.01% | Invest | |
| 1684.03 | 1 years | 3.7% | 4.3% | -0.63% | -2.14% | -3.75% | 22.11% | - | - | - | - | Invest |


| Fund Name | AUM (Cr.) | Risk | 1W | 1M | 3M | 6M | YTD | 1Y | 2Y | 3Y | 5Y | 10Y |
|---|
| Fund Name | Apr-2025 | Mar-2025 | Feb-2025 | Jan-2025 | Dec-2024 | Nov-2024 | Oct-2024 | Sep-2024 | Aug-2024 | Jul-2024 | Jun-2024 | May-2024 |
|---|
| Fund Name | 2025-Q2 | 2025-Q1 | 2024-Q4 | 2024-Q3 | 2024-Q2 | 2024-Q1 | 2023-Q4 | 2023-Q3 | 2023-Q2 | 2023-Q1 | 2022-Q4 | 2022-Q3 |
|---|
| Fund Name | 2025 | 2024 | 2023 | 2022 | 2021 | 2020 | 2019 | 2018 | 2017 | 2016 | 2015 | 2014 | 2013 |
|---|
| Fund Name | AUM (Cr.) | Risk | 1W | 1M | 3M | 6M | YTD | 1Y | 2Y | 3Y | 5Y | 10Y |
|---|
| Fund Name | AUM (Cr.) | Initial NAV | Final NAV | NAV Change | Absolute Ret. | Annalized Ret. |
|---|
| Fund Name | AUM (Cr.) | Risk | 6M | 1Y | 2Y | 3Y | 5Y | 10Y | From Launch | |
|---|---|---|---|---|---|---|---|---|---|---|
| 86.32 | Very High |
-1.71%
|
42.83%
|
32.5%
|
22.03%
|
-
|
-
|
18.31%
|
Invest | |
| 1089.01 | Very High |
14.54%
|
43.14%
|
36.41%
|
27.98%
|
14.74%
|
11.69%
|
6.61%
|
Invest | |
| 346.48 | Very High |
0.21%
|
5.34%
|
22.47%
|
22.63%
|
20.96%
|
-
|
19.69%
|
Invest | |
| 1022.83 | High |
-
|
-
|
-
|
-
|
-
|
-
|
-
|
Invest | |
| 79.59 | High |
-
|
-
|
-
|
-
|
-
|
-
|
-
|
Invest | |
| 164.28 | Very High |
-
|
-
|
-
|
-
|
-
|
-
|
-
|
Invest | |
| 1575.68 | High |
14.99%
|
45.75%
|
33.69%
|
27.38%
|
19.47%
|
15.06%
|
11.84%
|
Invest | |
| 1568.02 | Very High |
-2.87%
|
5.18%
|
-
|
-
|
-
|
-
|
19.71%
|
Invest | |
| 471.82 | High |
16.42%
|
48.81%
|
34.68%
|
27.92%
|
19.75%
|
15.16%
|
12.26%
|
Invest | |
| 80.36 | Average |
17.17%
|
50.27%
|
34.36%
|
27.6%
|
19.66%
|
14.8%
|
12.25%
|
Invest | |
| 113.72 | High |
15.52%
|
47.13%
|
34.06%
|
27.56%
|
19.57%
|
15.26%
|
12.02%
|
Invest | |
| 3059.77 | High |
14.95%
|
45.56%
|
33.33%
|
27.14%
|
19.33%
|
15.06%
|
11.84%
|
Invest | |
| 699.09 | High |
15%
|
45.71%
|
33.51%
|
27.32%
|
19.59%
|
15.21%
|
11.71%
|
Invest | |
| 2439.26 | Very High |
15.22%
|
46.4%
|
33.8%
|
27.38%
|
19.43%
|
15.01%
|
11.4%
|
Invest | |
| 57.09 | High |
15.39%
|
46.66%
|
-
|
-
|
-
|
-
|
39.51%
|
Invest | |
| 2520.47 | High |
15.06%
|
45.96%
|
33.55%
|
27.19%
|
19.26%
|
15.16%
|
11.54%
|
Invest | |
| 160.63 | High |
14.51%
|
44.85%
|
-
|
-
|
-
|
-
|
39.79%
|
Invest | |
| 2522 | High |
15.24%
|
46.37%
|
33.87%
|
27.51%
|
19.59%
|
15.22%
|
11.88%
|
Invest | |
| 189.7 | Moderately High |
12.85%
|
34.59%
|
23.15%
|
19.02%
|
14.61%
|
9.49%
|
8.1%
|
Invest | |
| 1684.03 | Very High |
-1.74%
|
2.78%
|
-
|
-
|
-
|
-
|
9.21%
|
Invest |
| Fund Name | Risk | Standard Deviation | Alpha | Beta | Sharpe Ratio | |
|---|---|---|---|---|---|---|
| Very High |
37.762%
|
-
|
-
|
0.106%
|
Invest | |
| Very High |
28.15%
|
-
|
-
|
0.206%
|
Invest | |
| Very High |
13.729%
|
3.516%
|
0.857%
|
0.66%
|
Invest | |
| High |
11.41%
|
-
|
0.98%
|
0.67%
|
Invest | |
| High |
-
|
-
|
-
|
-
|
Invest | |
| Very High |
22.9%
|
-
|
-
|
-
|
Invest | |
| High |
11.674%
|
-
|
-
|
0.914%
|
Invest | |
| Very High |
-
|
-
|
-
|
-
|
Invest | |
| High |
11.158%
|
-
|
-
|
0.931%
|
Invest | |
| Average |
11.587%
|
-
|
-
|
0.942%
|
Invest | |
| High |
11.545%
|
-
|
-
|
0.908%
|
Invest | |
| High |
11.463%
|
-
|
-
|
0.909%
|
Invest | |
| High |
11.278%
|
-
|
-
|
0.941%
|
Invest | |
| Very High |
11.486%
|
-
|
-
|
0.908%
|
Invest | |
| High |
-
|
-
|
-
|
-
|
Invest | |
| High |
10.94%
|
-
|
0.93%
|
0.62%
|
Invest | |
| High |
-
|
-
|
-
|
-
|
Invest | |
| High |
11.602%
|
-
|
-
|
0.938%
|
Invest | |
| Moderately High |
6.226%
|
6.034%
|
0.578%
|
0.958%
|
Invest | |
| Very High |
-
|
-
|
-
|
-
|
Invest |
| Fund Name | Min SIP | Min Lumpsum | Expense Ratio | Fund Manager | Launch Date | |
|---|---|---|---|---|---|---|
|
₹100
|
₹5000
|
0.53%
|
Ekta Gala
|
08-Dec 2021
|
Invest | |
|
₹100
|
₹100
|
2.36%
|
Jay Kothari
|
14-Sep 2007
|
Invest | |
|
₹0
|
₹5000
|
-
|
R. Srinivasan since Dec 2017
|
27-Mar 2018
|
Invest | |
|
₹100
|
₹100
|
0.54%
|
Sachin Wankhede
|
13-May 2011
|
Invest | |
|
₹100
|
₹100
|
0.48%
|
|
19-Dec 2023
|
Invest | |
|
₹100
|
₹100
|
0.37%
|
Aditya Pagaria
|
20-Sep 2022
|
Invest | |
|
₹100
|
₹100
|
0.39%
|
Manish Banthia
|
11-Oct 2011
|
Invest | |
|
₹100
|
₹100
|
2.14%
|
Dhruv Muchhal
|
04-Oct 2023
|
Invest | |
|
₹100
|
₹100
|
0.52%
|
Pranav Gupta
|
20-Mar 2012
|
Invest | |
|
₹1000
|
₹5000
|
0.66%
|
Sumit Bhatnagar
|
14-Aug 2012
|
Invest | |
|
₹500
|
₹1000
|
0.45%
|
Krishna Venkat Cheemalapati
|
05-Dec 2011
|
Invest | |
|
₹100
|
₹100
|
0.49%
|
Arun Agarwal
|
02-Nov 2011
|
Invest | |
|
₹100
|
₹100
|
0.5%
|
Aditya Pagaria
|
20-Oct 2011
|
Invest | |
|
₹100
|
₹100
|
0.35%
|
Himanshu Mange
|
07-Mar 2011
|
Invest | |
|
₹100
|
₹100
|
1%
|
Anil Ghelani
|
17-Nov 2023
|
Invest | |
|
₹100
|
₹100
|
0.5%
|
Abhishek Bisen
|
25-Mar 2011
|
Invest | |
|
₹150
|
₹5000
|
0.7%
|
Tapan Patel
|
19-Jan 2024
|
Invest | |
|
₹500
|
₹5000
|
0.42%
|
Raviprakash Sharma
|
12-Sep 2011
|
Invest | |
|
₹100
|
₹100
|
1.18%
|
Vivekanand Ramakrishnan
|
13-May 2003
|
Invest | |
|
₹500
|
₹500
|
2.1%
|
Ajay Khandelwal
|
06-Feb 2024
|
Invest |
| Fund Name | Current NAV | Previous NAV | 1D NAV Change | 52- Week High NAV | 52- Week Low NAV | |
|---|---|---|---|---|---|---|
|
10.849
(16-04-2025)
|
10.757
(15-04-2025)
|
0.86%
|
13.507
|
6.356
|
Invest | |
|
29.0529
(15-04-2025)
|
28.7334
(11-04-2025)
|
1.11%
|
29.0529
|
18.2123
|
Invest | |
|
28.2103
(16-04-2025)
|
27.8569
(15-04-2025)
|
1.27%
|
29.0018
|
21.163
|
Invest | |
|
83.6005
(16-04-2025)
|
82.308
(15-04-2025)
|
1.57%
|
-
|
-
|
Invest | |
|
92.5015
(16-04-2025)
|
91.0776
(15-04-2025)
|
1.56%
|
-
|
-
|
Invest | |
|
97.1831
(16-04-2025)
|
95.8545
(15-04-2025)
|
1.39%
|
-
|
-
|
Invest | |
|
29.5847
(16-04-2025)
|
28.9809
(15-04-2025)
|
2.08%
|
29.5847
|
21.6797
|
Invest | |
|
15.688
(16-04-2025)
|
15.693
(15-04-2025)
|
-0.03%
|
17.155
|
12.235
|
Invest | |
|
27.7639
(16-04-2025)
|
27.2977
(15-04-2025)
|
1.71%
|
27.7639
|
20.3363
|
Invest | |
|
24.7736
(16-04-2025)
|
24.4429
(15-04-2025)
|
1.35%
|
24.7736
|
18.3503
|
Invest | |
|
27.0983
(16-04-2025)
|
26.6599
(15-04-2025)
|
1.64%
|
27.0983
|
19.9579
|
Invest | |
|
28.5453
(16-04-2025)
|
28.0735
(15-04-2025)
|
1.68%
|
28.5453
|
20.9579
|
Invest | |
|
27.9325
(16-04-2025)
|
27.3441
(15-04-2025)
|
2.15%
|
27.9325
|
20.577
|
Invest | |
|
36.6156
(16-04-2025)
|
35.8905
(15-04-2025)
|
2.02%
|
36.6156
|
26.6165
|
Invest | |
|
14.9490
(16-04-2025)
|
14.7477
(15-04-2025)
|
1.36%
|
14.949
|
11.0718
|
Invest | |
|
36.6841
(16-04-2025)
|
36.004
(15-04-2025)
|
1.89%
|
36.6841
|
27.0804
|
Invest | |
|
14.7561
(16-04-2025)
|
14.5364
(15-04-2025)
|
1.51%
|
14.7561
|
10.926
|
Invest | |
|
27.8980
(16-04-2025)
|
27.3883
(15-04-2025)
|
1.86%
|
27.898
|
20.4884
|
Invest | |
|
48.6169
(16-04-2025)
|
48.5911
(15-04-2025)
|
0.05%
|
48.6169
|
39.7601
|
Invest | |
|
12.7345
(16-04-2025)
|
12.7025
(15-04-2025)
|
0.25%
|
13.4238
|
10.4074
|
Invest |

Mutual Funds Calculator & Tools


Asset Management Companies (30+ AMC’s)
At MySIPOnline , We believe everyone deserves to reach their financial goals. That's why we offer a wide range of asset management services designed to help you achieve financial success.
View All AMC’s


How do Mutual Funds Work?
A Mutual fund works as an investment vehicle that collects money to invest in a diversified portfolio such as stocks, bonds other securities. Now, when you are investing in a mutual funds scheme, it allots specific units called NAV or net asset value that represents your holdings or ownership in a particular fund. Let's see a step-by-step guide to how mutual funds work:
- Pooling Money: Investors give money by buying shares or units in the mutual fund. This collective money is managed by experts.
- Investment Strategy: The fund manager uses the pooled money to invest in various assets based on the fund's objectives (e.g., stocks for growth, bonds for income).
- NAV Calculation: The value of one share of the fund is known as the NAV or the Net Asset Value. It’s calculated by dividing the total value of the fund’s investments by the number of outstanding shares. The net asset value changes daily based on the performance of the assets.
- Value Changes: If the investments do well, the NAV goes up, and if they perform poorly, the NAV goes down.
- Returns to Investors: Investors earn returns through capital gains (profits from selling assets) and income distributions (like dividends or interest). These returns can be reinvested or paid out to investors.
- Buying and Selling: Investors can buy or sell their shares in the mutual fund at the NAV (net asset value) price that is calculated at the end of each trading day.
- Fees: The mutual funds charge a fee for managing your investments and administrative costs and exit loads. It is necessary to understand that these can affect your total returns.
- Tax Implications: Mutual fund returns are subject to capital gains tax. Investors pay taxes on any profits made by the fund.
Example of how NAV is calculated:
Imagine you invest Rs 10,000 in a mutual fund. The fund’s NAV is Rs 10, and you buy 1,000 units.
- If the NAV increases to Rs 12 after a year, your 1,000 units will now be worth Rs 12,000, giving you a profit of Rs 2,000.
- If the NAV drops to Rs 8, your investment would be worth Rs 8,000, resulting in a loss of Rs 2,000.
Skip the paperwork and fast-track your online SIP with One Click.
How to Choose the Right Mutual Fund for You?
You can filter the Best Mutual Funds by using these 4 principles:
- Investment Strategy: Make sure that the investment strategy match with your financial goals and risk taking capacity. Observe the fund based on its growth, balanced approach and asset allocation to measure the quality it brings to your portfolio.
- Consistency in Returns: Look at the fund's past track record, like trailing and rolling returns, which will give you an idea of how the fund performs during market volatility. The best mutual funds showcase stable performance in the long term with timely recovery.
- Robust Fund Management: The consistency of the fund manager is very important. It speaks to the understanding of the fund and managing tactics of the manager, giving higher chances of strong returns.
- Risk & Reward Ratio: Use key metrics such as standard deviation, which measures volatility and beta and compare risk to the fund's benchmark. It helps you understand how much return the fund generates per unit of risk taken.
Direct Plan Vs Regular Plan: Which is Better?
Mutual funds offer you investment via two different types of plans: direct and regular plans. Here is a comparison of direct plans vs regular plans based on several parameters:
| Particulars | Direct Plan | Regular Plan |
|---|---|---|
| Assistance/ Recommendations | No | At every step, you are assisted by a mutual funds expert |
| NAV (Net Asset Value) | Higher | Lower |
| Market Analysis Required | Yes | No |
| Research on Funds Required | Deep analysis is required as you may miss the buy-and-sell opportunity | Not required as an advisor will assist you |
| Convenience | Less | More |
| Time Consumption | More | Less |
How to Invest in Mutual Funds via MySIPonline?
Here is a quick and easy guide to starting your mutual fund's investment:
- Sign Up: Register using your email and OTP for a secure account.
- Select Fund: Choose the mutual fund you want to invest in.
- Enter Investment Amount: Decide how much you want to invest.
- Investment Type: Select one-time lumpsum investment or start a SIP (Systematic Investment Plan).
- Enter Details: Provide your PAN full name and verify your mobile number.
- Bank Details: Input your bank account details and select the payment method.
- Set Up SIP (if applicable): For SIP, set up a payment mandate.
- Complete KYC: Go through the KYC process by uploading a selfie, completing a live video and e-signing.
- Transaction Processing: Once KYC is verified, your transaction will be processed.
What are the Tax Implications on the Best Mutual Funds in India?
Here is how you can calculate tax implications on your mutual funds under the New Tax Regime:
-
Equity Mutual Funds
- Short-Term Capital Gains (STCG): If you sell your units within 1 year, the gains are taxed at 15%.
- Long-Term Capital Gains (LTCG): If you hold the units for more than 1 year, the gains over Rs.1 lakh in a financial year are taxed at 10% without the benefit of indexation.
-
Debt Mutual Funds
- Short-Term Capital Gains (STCG): If sold within 3 years, the gains add to your income and are taxed as per your income tax slab.
- Long-Term Capital Gains (LTCG): If held for more than 3 years, you are taxedat 20% with indexation.
-
Hybrid Funds (Combination of Equity and Debt)
- Taxation depends on the fund’s asset allocation. If more than 65% of the fund’s assets are in equities, it is taxed as an equity fund. Otherwise, it follows the debt fund tax rules.
-
Dividend Income
- Equity Funds: Dividends are tax-free in the hands of investors.
- Debt Funds: Dividends are subject to 10% TDS if the amount exceeds Rs.5,000 in a financial year.
New Fund Offerings
Explore newly launched mutual funds by AMC and pick the one that fits your goals & needs.
View All NFO
Related Blogs & Videos
Blogs
Videos

-
 104
104 -
 5 Min. Read

-
282
-
5 Min. Read

-
620
-
5 Min. Read

-
453
-
5 Min. Read


 You can select three funds for compare.
 0
0
Frequently Asked Questions
Here are the 3 top-performing mutual funds to start your SIP:
| Scheme Name | Launch Date | AUM (Cr) as of 30.10.24 |
|---|---|---|
| ICICI Pru Large & Mid Cap Fund | 09.07.1988 | 17,120 |
| ICICI Prudential Short Term Fund | 01.10.2001 | 19,922 |
| HDFC Balance Advantage Fund | 01.02.1994 | 94,865 |
You can earn returns on your mutual funds through dividends and capital gains.
Mutual funds provide a number of schemes suiting the goals and objective of investors from every category. To choose the right fund for yourself, you can either research for yourself or take the assistance of a financial expert.
The net asset value is the per unit price at which you buy and sell your mutual funds. It is calculated by dividing the total assets of the fund minus liabilities by the number of outstanding units.
The SEBI (Securities and Exchange Board of India) is the regulatory body that governs the mutual funds industry in India
A fund manager is in charge of managing a mutual fund's portfolio using their expertise to adjust the fund's assets to meet your financial goals.
To complete your KYC (know your customer), you require identity proof and address proof such as PAN and Aadhar card, passport, bank statement etc.
The ELSS Funds (equity-linked schemes) are the only category in mutual funds that offer tax deductions under section 80C.
Investing App for Everyone Start Your Investing Journey Today!


- 10+ Years In Business
- 1,50,000+ People Invested
- 5 Billion+ Assets Under Management
- 4.3 Star Users Rating

-
 Deep Research by Experts
-
Tailored to Your Needs
-
Quality Fund Manager & strong portfolios
-
Carefully Shortlisted

